Eclipse ARM Toolchain
This tutorial here will cover how to expand the GNU ARM toolchain by Eclipse, the Integrated Development Environment.
It is required that you already have installed the GNU ARM toolchain.
Note: This tutorial was made with Eclipse 4.3.2, the Kepler release.
How to use?
The next section is a pretty large one. Go ahead and take a quick break. Visit the facilities or brew a fresh pot of tea. When you get back, we will start with Eclipse.
Click on the shortcut which you have created in the step before:
After the start of Eclipse you should see the following splash screen:
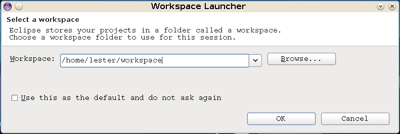
If not, you have a problem with the Java Runtime Environment. After a while Eclipse want to know where to store your projects:
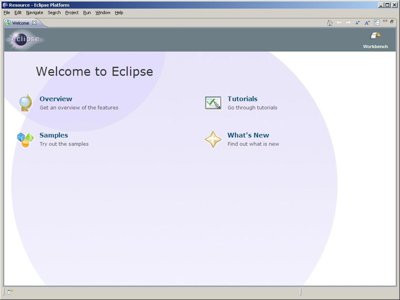
I will use C:\workspace for the Eclipse workspace. Enter your directory and press "OK". Now the following "Welcome" window will appear:
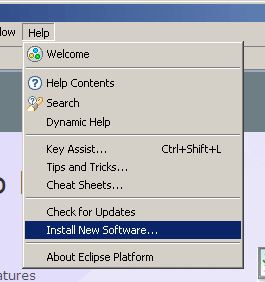
Now we must install the C/C++ Development Tooling - CDT. Therefore use "Help-> InstallNew Software...":
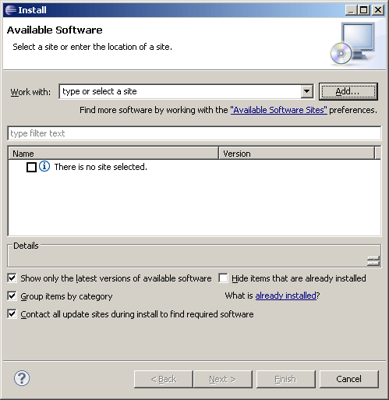
The next window will be show up:
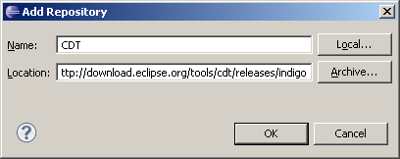
Press the "Add..." button and fill in the Repository information. Use " CDT" for the "Name" and "http://download.eclipse.org/tools/cdt/releases/indigo" for the "Location"Now the Eclipse window should look like:
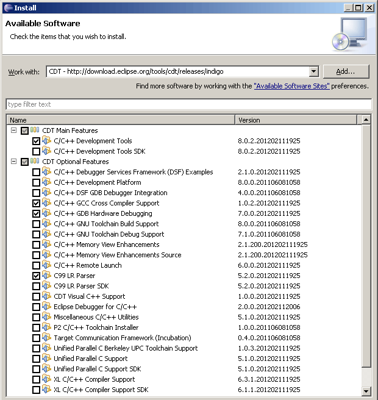
Press "OK" (it could takes a while) and you must now select the feature you want to install.
Select "CDT Main Features":
- C/C++ Development Tools
And from the "CDT Optional Features" select:
- C/C++ GCC Cross Compiler Support
- C/C++ GDB Hardware Debugging
- C99 LR Parser
The window should look like:
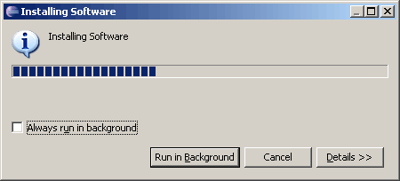
Press "Next" and "Next" again. Now you must accept the license agreements. Therefore select this options, and press "Finish". Now it can takes some time while the new software will be installed:
After the software update you must restart Eclipse now:
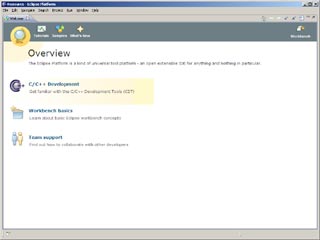
Press the "Restart Now" button and wait while Eclipse will be restarted. After the restart you will see the start screen again:
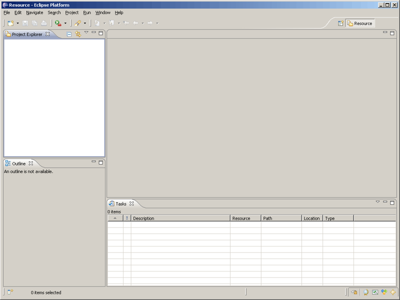
Now click at the "Workbench" icon at the right upper edge of the window, and the next window will look like:
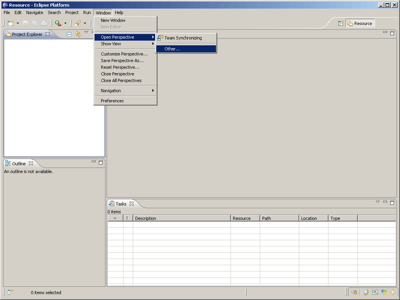
This is the "Resource Perspective", but we need to open the "C/C++ Perspective". Use "Window / Open Perspective / Other ..."
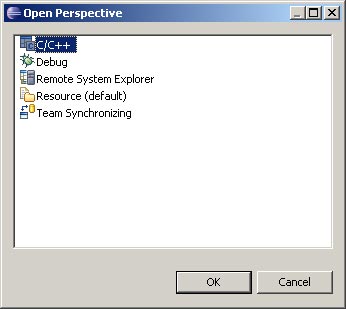
The next window will be opened:
Select "C/C++" and press the "OK" button. Now the "C/C++" and
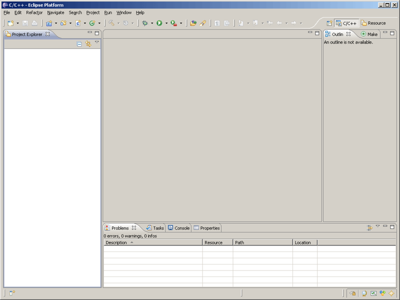
"Resource Perspective" are part of the window:
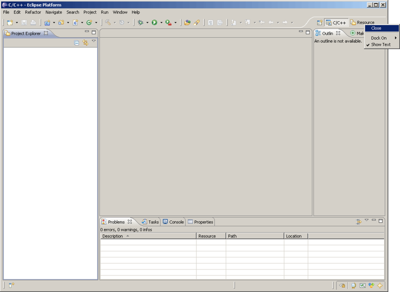
We only need the "C/C++ Perspective" and may close the Resource one. Therefore right click at the Resource icon and close the Perspective:
Now the window should look like:
What's next? Now let's start with a small example. Therefore I have created these examples for it. Download the example you need and expand the zip file in your temp directory.
I will show you the next steps with the SAM7X256Test example. For this purpose, I expanded it in the following directory:
C:\temp\SAM7X256Test
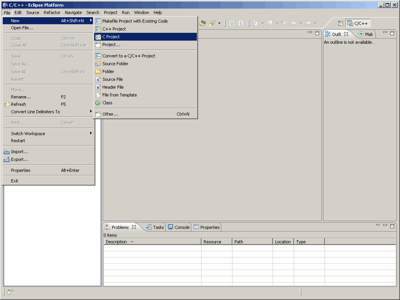
To create an Eclipse project use: "File / New / C Project"
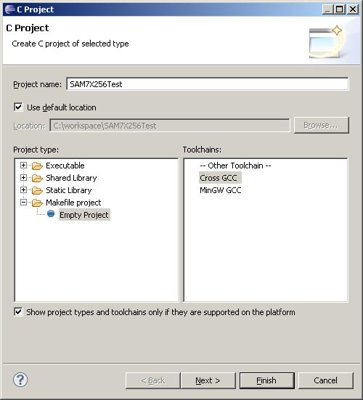
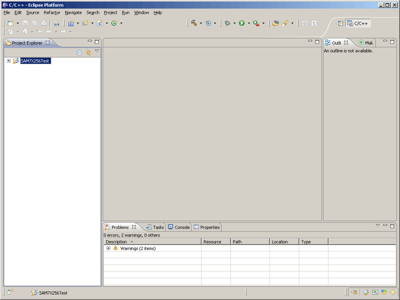
Here you will see that the "Location" is your workspace directory you created some steps above. Type in the "Project name" (I will use SAM7X256Test) and Select "Makefile project" and "Cross GCC", after this press the "Finish" button. Now the Eclipse window should look like:
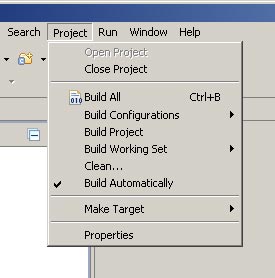
You just created your first Eclipse project. You now need to configure it. Use the "Projet" menu and remove the checkmark at "Build Automatically":
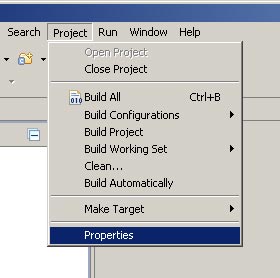
Use the "Project" menu again and select "Properties":
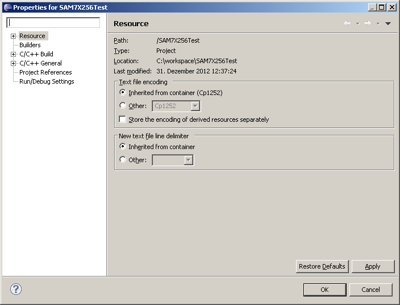
A new window will be opened:
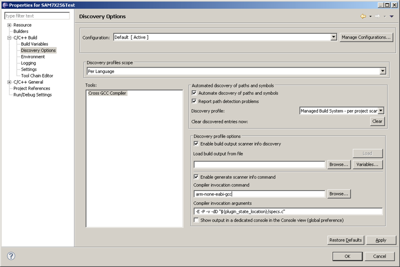
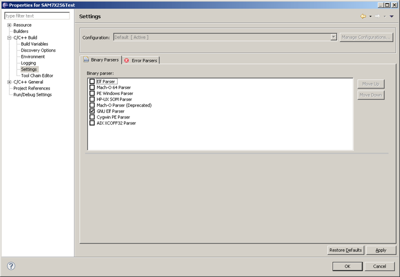
use now the "Discovery Options" under "C/C++ Build" page and change the "Compiler invocation command" to "arm-none-eabi-gcc":
Press the "OK" button to finish this dialog.
Your project is empty and you must import the project files to Eclipse.
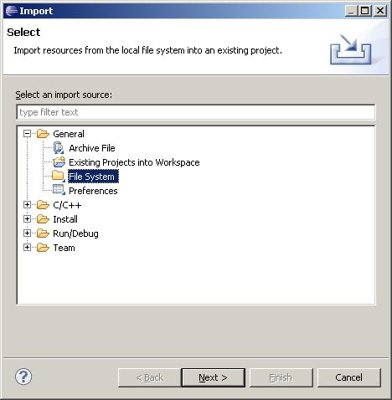
Use the "File / Import..." menu and select the "File System" as input source:
Press the "Next" button to open the "Import" dialog:
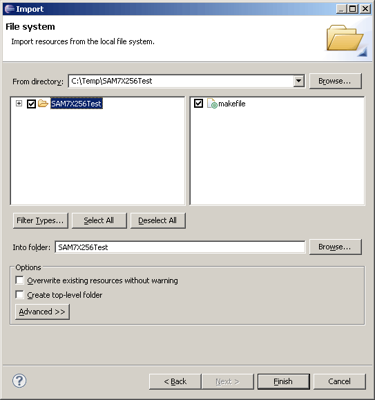
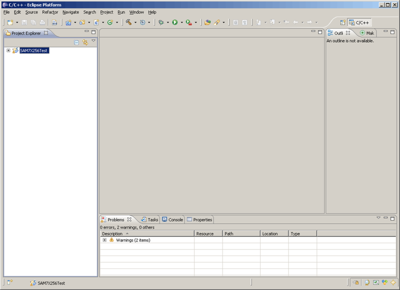
But what files? You downloaded one of the examples above and expanded the zip file into a temp directory (I used C:\temp\SAM7X256Test). Select this directory for " From directory" and select all files with the checkmark. Press "Finish" to close the dialog. Your project should now look like:
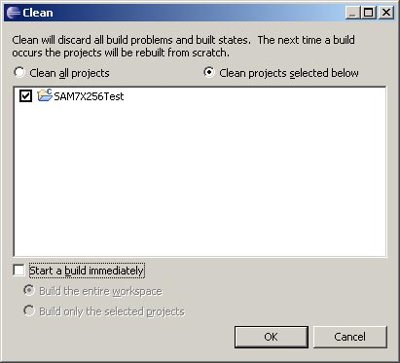
Now let's "clean" the project. For this purpose use " Project / Clean... ". Set the options according to the next window:
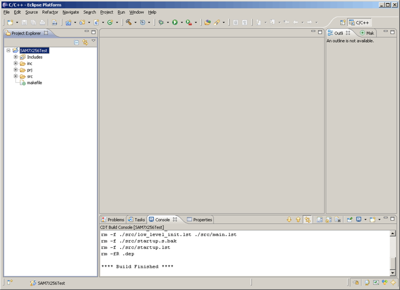
Remove the checkmark at "Start a build immediately", and press "OK". The "Console" will show the result of the "Clean" command:
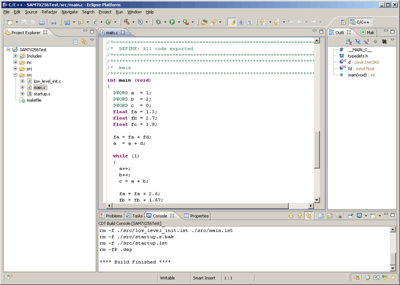
By the way, you can open any source file by simply double clicking on it. The editor will open up:
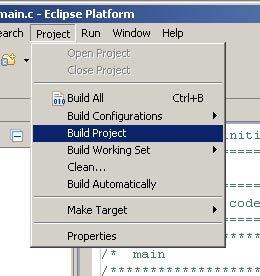
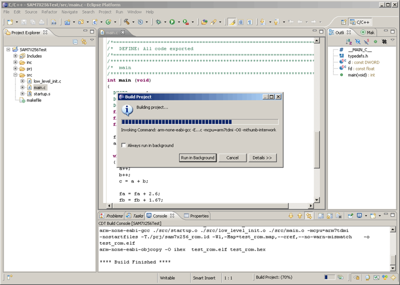
But do not change the file. Now let's build the project using "Project / Build Project":
The project will be build, and the window look like:
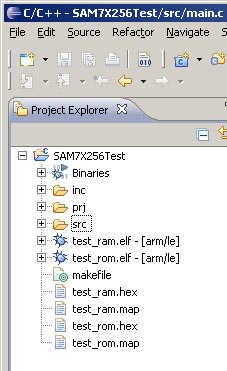
At the same time you will see the result of the build process inside the "Console" window. After a successful build process, an elf file was created:
Now it is time for a break again. When you get back, we will start to install and configure the debugger.
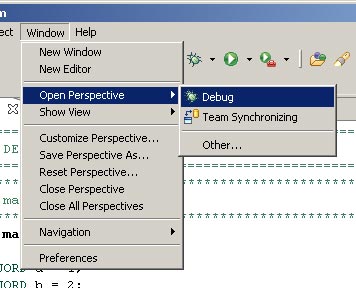
For the debug process we need to open the "Debug Perspective". For this purpose use "Window / Open Perspective / Debug":
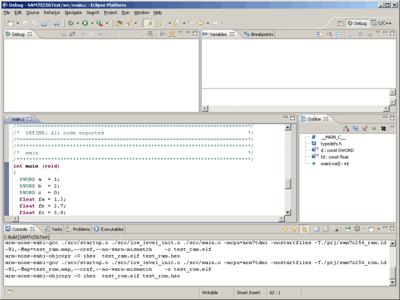
The new perspective will be opened. It looks like:
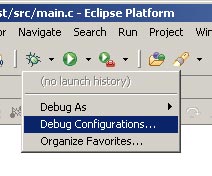
Now we need to configure the debugger. You can reach the configuration by clicking on the down arrow at the "insect" button. That brings up the pull-down menu:
And select "Debug Configuration...":
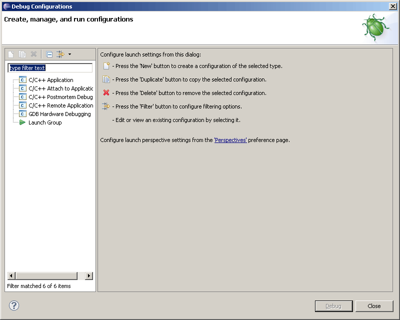
The next window will look like:
Select "GDB Hardware Debugging" and press the "New" button to create a configuration of selected type. The "New" button look like:
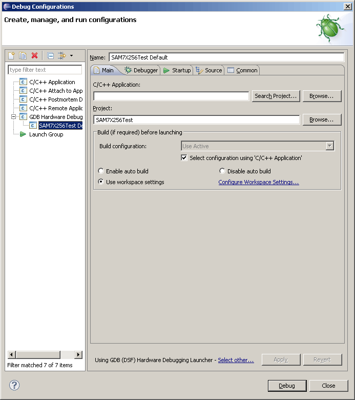
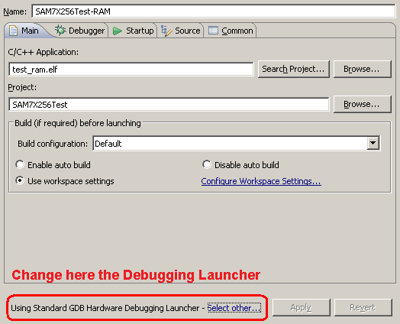
The configuration window will be changed and look like:
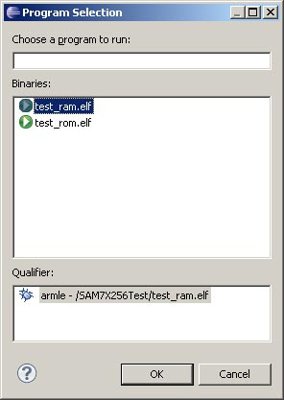
Click at the "Search Project..." button and select the test_ram.elf file:
Press "OK" and change the project name from "SAM7X256Test Default" to "SAM7X256Test-RAM". This will help you later to identify your project if you want to debug in RAM or Flash. At the botton of the window you can select the GDB Launcer, change it to "Standard GDB Hardware Debugging Launcher". Your configuration window should now look like:
Note: This view is only the right part of the configuration window.
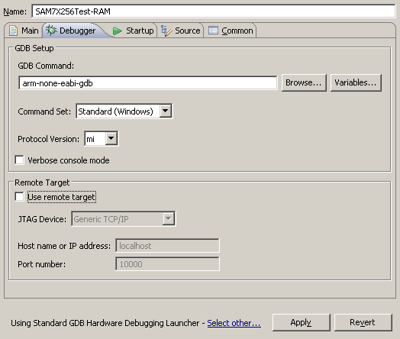
Select the "Debugger" tab and and change the GDB debugger to
"arm-none-eabi-gdb". After this, do not forget to remove the "Use remote target" check mark too:
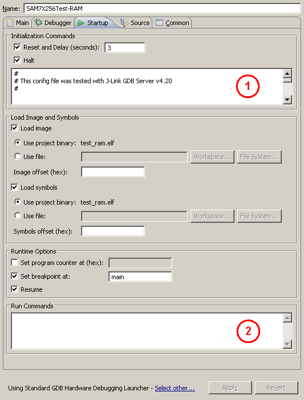
Now change to the "Startup" tab and use the following settings:
A file called sam7x256_ram_jlink.gdb is part of the example. Copy and paste the contents of the test file into the "Initialization Commands" area 1.
Note: The setup for the Cortex M3 examples are slightly different. For these examples you will find two separate script files called xxx_1.gdb and xxx_2.gdb within the project folder. Copy the contents of xxx_1.gdb into the text box under Initialization Commands (1) and copy the contents of xxx_2.gdb into the text box under Run Commands (2). Do not check the boxes "Set Breakpoint at:" or "Resume".
Now you are done with the configuration and you may close the dialog with the "Close" button. Press "YES" to save the changes:
For debuging with Eclipse we will use the GDB, therefore we need a GDB Server which you have installed from part 1. Connect the J-Link EDU to the PC and to the target (do not forget to power the target) and start the J-Link GDB Server.
Now we can start the debug session. Eclipse should look like:
Unknown Image
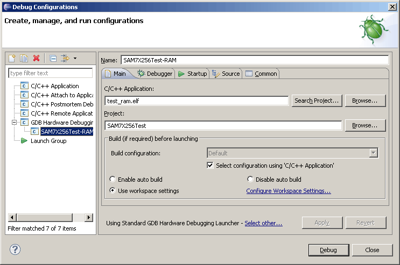
The debugger will be started the first time using the configuration menu:
Here you will find your new configuration "SAM7X256Test-RAM":
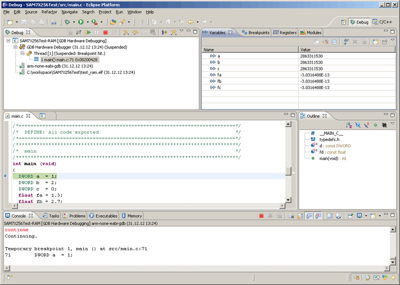
Press the "Debug" button to start the debugger. Eclipse should look like:
The debugger is running, congratulation.
The window at the bottom is the "GDB Debugger" command window. The upper left window is the "Debug" window. Here you will find some icons for stepping through the code (some more info later). The highlighted line in the source window (main.c) is the actual line which will be executed in the next step.
The upper right window shows the "Variables". You can change the view to "Breakpoints", "Register" and "Modules". Don't worry about the strange values. That is OK at this time, because these variables are not yet initialized.
You can step through the code with the following button (in the Debug window):
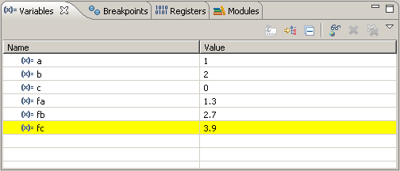
Take a look at the "Variables" window. After six steps the windows should look like:
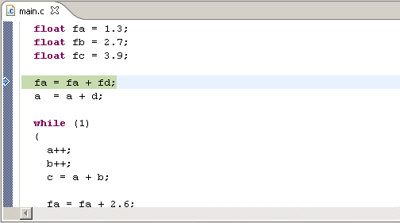
And the source window:
With the six steps from above, the variables was set. And the next line will be
fa = fa + fd.
Note: The line which is highlighted is not yet executed This will be done with the next step.
How to set a breakpoint?
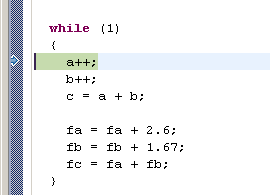
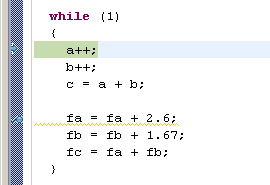
Setting a breakpoint is very easy. Double click in the left gray area of the soucre window. I mean the area where the blue arrow is:
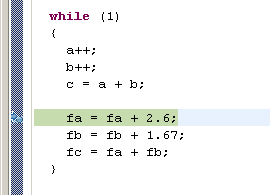
If you double click in line of fa = fa + 2.6, a breakpoint will be set:
The blue checkmark with the blue dot is the new breakpoint. You can remove the breakpoint by double clicking on it again. Now we want to use the "Resume" button:
The program will be executed and it will stop at the breakpoint.
The value of the variables was changed to a = 9, b = 3, c = 12.
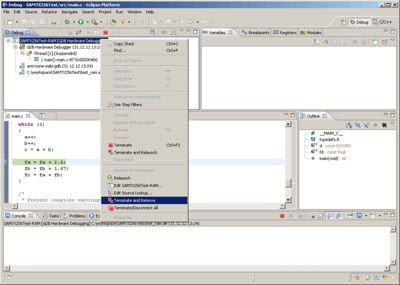
You can "Terminate and Remove" your debug task with a right click on
"SAM7X256Test-RAM" inside the "Debug" window:
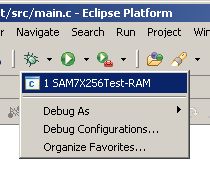
You can start the debugger again by the "insect", but at this time you will find an entry for SAM7X256Test-RAMt:
The story is over, many thanks to: JRE, Eclipse and CDT :o)
In case you have problem to stop / launch the debug process, close Eclipse the GDB Server and execute an RESET on the target. After this you can start Eclipse and the GDB Server again.
All of the software like the Eclipse Platform Runtime Binary, Eclipse CDT and the GDB embedded plugin falls unter the Eclipse Public License - v 1.0

