J-Link GDB Server
Here I will show you how to install the J-Link GDB Server. The J-Link GDB Server is a remote server for the GDB. The GDB Server translates the GDB commands into the J-Link commands.
The intention of my side was to find an inexpensive & easy to use solution for the beginners. Fortunately SEGGER offers now a J-Link ARM EDU package of the J-Link which includes the following options:
- J-Link ARM, USB powered JTAG emulator
- A license for the J-Link GDB Server
- A license for the Flash download (FlashDL)
- A license for the Flash breakpoints (FlashBP)
The J-Link ARM EDU version supports download in RAM and Flash, as well as an unlimited number of breakpoints in flash (Flash Breakpoints). J-Link EDU is sold to private persons, colleges, schools, universities and NPOs (Non Profit Organizations) for educational purposes only.
More information about the EDU version of the J-Link can be found here.
For the GDB Server we need the J-Link "Software and documention pack".
The J-Link is developed by SEGGER, therefore you can download the latest software from the SEGGER J-Link ARM software page.
Download the "Software and documentation pack", expand the zip file, and start the setup program. For more information about how to install and setup the J-Link itself, take a look in the J-Link manual (pdf, about 2MB), which can be found at the following SEGGER page.
The GNU Project Debugger (GDB) is a freely available debugger, distributed under the terms of the GPL. It connects to an emulator via a TCP/IP connection. It can connect to every emulator for which a GDB Server software is available.
For debuging with Eclipse we will use the GDB, therefore we need a GDB Server too.
At this point you must already installed the J-Link "Software and documention pack". Connect the J-Link to the PC and to the target (do not forget to power the target) and start the "J-Link GDB Server".
You will find the "J-Link GDB Server" in the "SEGGER \ J-Link ARM" program goup.
When the GDB Server will be started you should see the following window:
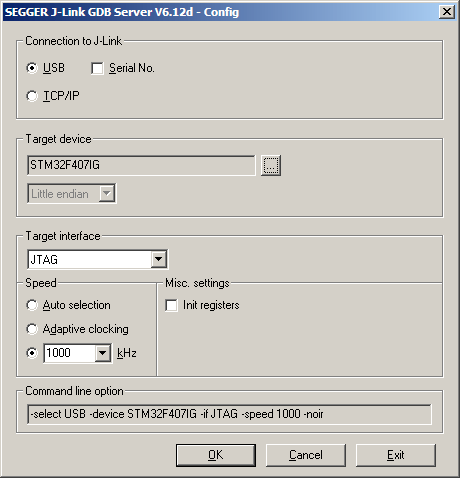
Here you can select some options, e.g. the "Target interface". Make your selections, and press "OK". The next window will look like:
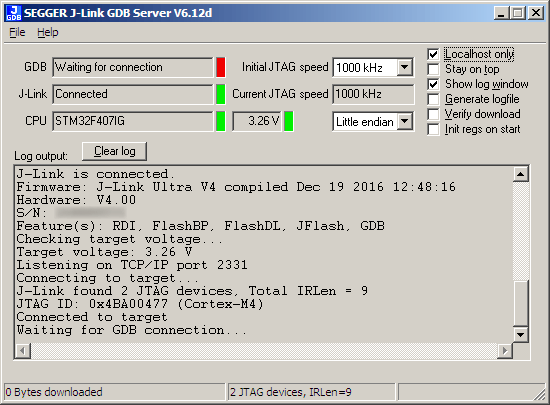
Remove the checkmark of the "Stay on top" option. Then set the checkmark at "Show log window", "Cache reads" and "Init regs on start".
The "Show log window" options can help us if we will get in trouble with Eclipse. "Cache reads" will enable a memory read-ahead optimization which can speed up debugging. If you have a big screen resolution you can let the checkmark at "Stay on top", but we need all the available screen space later.
If you need support, take a look here: